Next: The most important parameters,
Up: Volume vs. energy, volume
Previous: Accurate bulk relaxations with
Contents
This is a very common questions from people who start to
do calculations with plane wave codes.
There are two reasons why the energy vs. volume plot looks
jagged:
- Basis set incompleteness.
The basis set is discrete and incomplete, and when the volume changes,
additional plane waves are added. That causes small discontinuous changes
in the energy.
Solutions:
- use a larger plane wave cutoff:
This is usually the preferred and cheapest solution.
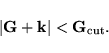
- use more k-points :
This solves the problem, because the criterion for including a plane wave
in the basis set is:
That means, at each k-point a different basis set is used, and additional
plane waves are added at each k-point at different volumes. In turn,
the energy vs. volume curve becomes smoother.
- However the most probable reason for the jagged E(V) curve
is another one:
For PREC=High the FFT grids are chosen so that
 is exactly evaluated.
For PREC=Med the FFT grids are set to 3/4 of the value that is
in principle required
for an exact evaluation of
. This introduces small errors,
because
when the volume changes the FFT grids do change discontinuously.
In other words, at each volume a different FFT-grid is used,
causing the energy to jump discontinuously.
is exactly evaluated.
For PREC=Med the FFT grids are set to 3/4 of the value that is
in principle required
for an exact evaluation of
. This introduces small errors,
because
when the volume changes the FFT grids do change discontinuously.
In other words, at each volume a different FFT-grid is used,
causing the energy to jump discontinuously.
Solutions:
- Set your FFT grids manually. Choose that one that is used per default for the largest
volume
- use PREC=High. In the new version (starting from VASP.4.4.3) this
also increases the plane wave cutoff by 30 %.
If this is undesirable, the plane wave cutoff can be fixed
manually by specifying ENMAX=... in the INCAR file
Next: The most important parameters,
Up: Volume vs. energy, volume
Previous: Accurate bulk relaxations with
Contents
Georg Kresse
2009-04-23